Top SMB Security Vulnerabilities A Guide
Top SMB security vulnerabilities are a serious threat to small and medium-sized businesses. Ignoring these weaknesses can lead to devastating consequences, from data breaches and financial losses to reputational damage and even business closure. This post dives into the most common threats facing SMBs, offering practical advice and actionable steps to bolster your defenses. We’ll explore everything from phishing scams and malware infections to weak passwords and inadequate network security, equipping you with the knowledge to protect your business.
Understanding these vulnerabilities isn’t just about technical know-how; it’s about recognizing the human element too. Social engineering, for example, often exploits employee weaknesses, highlighting the critical need for comprehensive security awareness training. We’ll cover strategies for creating strong passwords, implementing multi-factor authentication, and staying on top of software updates – all essential for building a robust security posture.
Phishing and Social Engineering Attacks

Phishing and social engineering attacks represent a significant threat to small and medium-sized businesses (SMBs). Unlike sophisticated malware, these attacks rely on human error, making them surprisingly effective and difficult to defend against. A successful attack can lead to data breaches, financial losses, and reputational damage, impacting an SMB’s ability to operate effectively. Understanding the tactics used and implementing robust preventative measures is crucial for survival in today’s digital landscape.
Common Phishing Techniques Against SMBs
SMBs are often targeted with various phishing techniques due to their perceived lack of robust security infrastructure. These techniques exploit human psychology to trick individuals into revealing sensitive information or downloading malicious software. One common tactic is using email spoofing to make emails appear as if they’re from legitimate sources like banks, payment processors, or even internal colleagues.
Another involves creating convincing fake websites that mimic real login pages, prompting users to enter their credentials. Finally, SMS phishing (smishing) uses text messages to deliver malicious links or requests for personal information. The urgency and personalized nature of these messages often lead to successful attacks. For example, an email claiming a critical system update requires immediate action or a text message indicating a missed delivery requiring immediate payment can be highly effective.
Steps Involved in a Successful Social Engineering Attack Targeting an SMB
A successful social engineering attack against an SMB typically follows a series of carefully planned steps. It begins with reconnaissance, where attackers gather information about the target company and its employees through online searches, social media, and even dumpster diving. Next, they identify a vulnerable individual, perhaps someone known for being less tech-savvy or more trusting. The attacker then establishes trust through carefully crafted communication, often employing urgency and authority to pressure the victim into action.
The attack itself involves getting the victim to perform a specific action, such as clicking a malicious link, downloading a file, or revealing sensitive information. Finally, the attacker exploits the compromised access to steal data, install malware, or gain control of systems. Consider a scenario where an attacker impersonates the CEO via email, requesting an urgent wire transfer to a supplier.
The urgency and apparent authority might convince a less experienced employee to comply without verification.
Training Program to Educate SMB Employees About Phishing and Social Engineering
A comprehensive training program is vital to protect SMBs from these attacks. The program should begin with raising awareness about the different types of phishing and social engineering attacks. This includes real-life examples and case studies to illustrate the potential consequences. Employees should be taught to identify suspicious emails, websites, and messages, focusing on identifying inconsistencies in email addresses, website URLs, and communication styles.
Hands-on training exercises, such as simulated phishing attacks, can help reinforce learning and improve employee vigilance. Regular refresher training should also be incorporated to maintain awareness and adapt to evolving tactics. The program should emphasize the importance of verifying information through official channels before taking any action, especially when dealing with sensitive data or financial transactions.
Comparison of Different Phishing Attack Types
Understanding the nuances of different phishing attack types is crucial for effective prevention.
| Type | Description | Target | Prevention |
|---|---|---|---|
| Spear Phishing | Highly targeted phishing attacks using personalized information to increase credibility. | Specific individuals within an organization. | Employee training, multi-factor authentication, email authentication protocols (SPF, DKIM, DMARC). |
| Whaling | Spear phishing targeting high-profile individuals (e.g., CEOs, CFOs) within an organization. | Executives and senior management. | Stronger security measures, enhanced authentication, and specialized security awareness training for executives. |
| Clone Phishing | Phishing attacks that mimic legitimate emails or websites. | Broad range of users. | Careful examination of email headers and URLs, robust email filtering, and employee training. |
| Decoy Phishing | Phishing attacks that use seemingly harmless links or attachments to lure victims. | Broad range of users. | Security awareness training emphasizing cautious clicking behavior, and URL verification. |
Malware Infections
Malware poses a significant threat to SMBs, potentially leading to data breaches, financial losses, and reputational damage. Understanding the different types of malware and implementing robust preventative measures are crucial for minimizing risk. This section will explore common malware threats and strategies for protection and recovery.
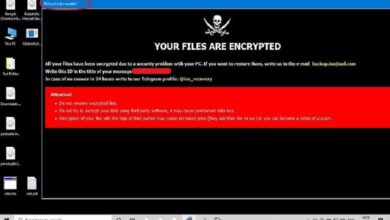
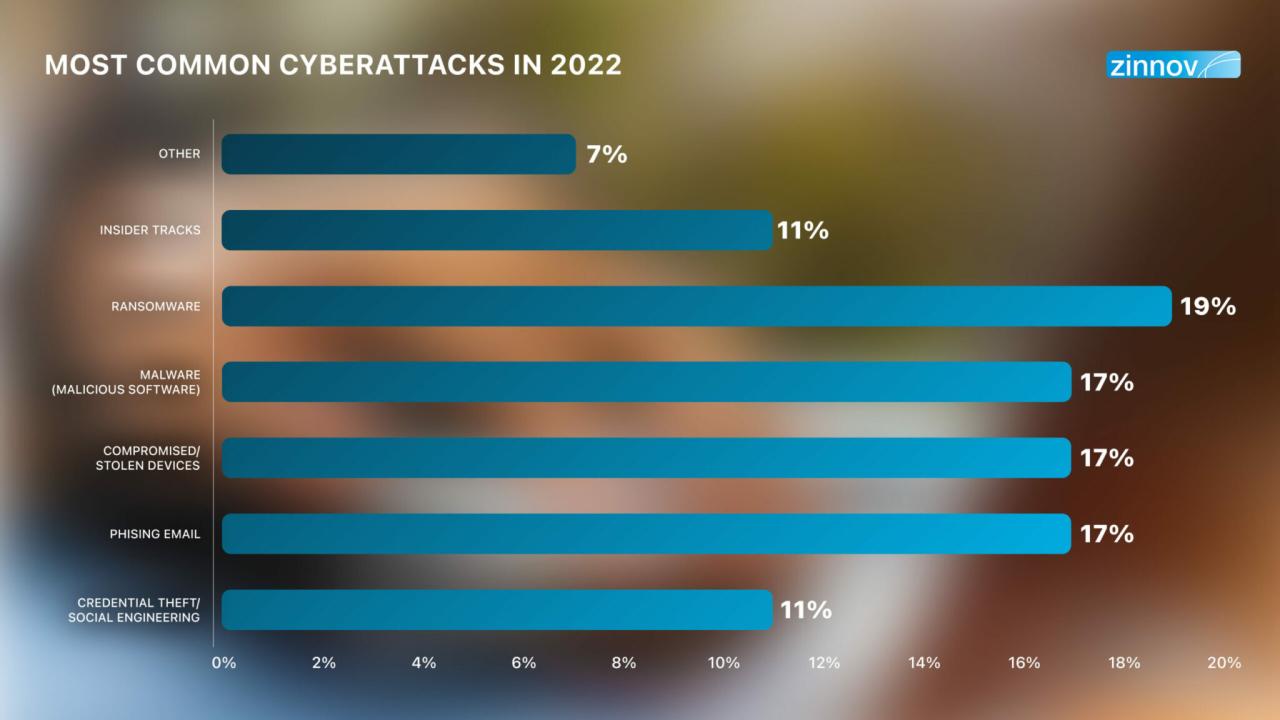
Several types of malware frequently target small and medium-sized businesses. Ransomware, perhaps the most notorious, encrypts critical data and demands a ransom for its release. Spyware secretly monitors user activity, stealing sensitive information like login credentials and financial data. Trojans, disguised as legitimate software, often install other malicious programs or provide backdoor access to a system. Viruses replicate themselves and spread to other systems, while worms spread independently across networks without needing a host program.
Finally, adware displays unwanted advertisements, often slowing down system performance and potentially exposing users to malicious websites.
Preventing Malware Infections
Proactive measures are far more effective and cost-efficient than reactive remediation. A multi-layered approach is recommended, combining technical safeguards with employee training and awareness. This includes regularly updating software and operating systems to patch known vulnerabilities, implementing strong firewall protection, utilizing robust antivirus and anti-malware software, and regularly backing up critical data to an offline location. Employee education is paramount; regular security awareness training should emphasize phishing recognition, safe browsing practices, and the dangers of clicking on suspicious links or downloading unknown files.
Restricting administrative privileges to only essential personnel further limits the potential damage from a successful malware attack. Finally, network segmentation can limit the spread of malware if an infection does occur.
Recovering from a Ransomware Attack
Recovering from a ransomware attack is a complex process that requires careful planning and execution. First, isolate the affected systems from the network to prevent further spread. Next, assess the extent of the damage, identifying which systems and data have been encrypted. While paying the ransom is generally discouraged due to the lack of guarantee of data recovery and potential encouragement of future attacks, it may be considered as a last resort after exhausting all other options.
The most effective recovery strategy relies on having a recent, clean backup of your data. Restore your systems and data from this backup, verifying its integrity before reconnecting to the network. Thoroughly investigate the source of the infection to prevent future attacks. This might involve engaging cybersecurity professionals for forensic analysis and remediation.
Effective Antivirus and Anti-Malware Solutions for SMBs
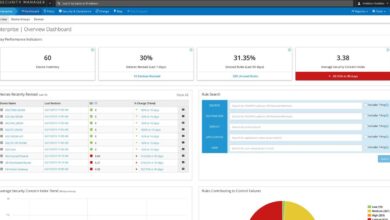
Choosing the right security software is critical. Several reputable vendors offer solutions tailored to the needs of SMBs. The best choice will depend on factors like budget, technical expertise, and the specific needs of the business. Some popular options include (but are not limited to): Microsoft Defender for Business, Sophos Intercept X, CrowdStrike Falcon, and Bitdefender GravityZone.
These solutions often offer a combination of antivirus, anti-malware, endpoint detection and response (EDR), and other security features. It’s important to carefully evaluate the features and pricing of different solutions before making a decision. Regular updates and monitoring of the software are crucial for maintaining its effectiveness. Consider a layered approach, using multiple security tools to enhance overall protection.
Weak or Stolen Credentials
Weak passwords and the practice of reusing passwords across multiple accounts are significant vulnerabilities for small and medium-sized businesses (SMBs). A single compromised credential can grant attackers access to a company’s entire network, leading to data breaches, financial losses, and reputational damage. The consequences can be devastating, especially for businesses that lack robust security measures.The ease with which attackers can exploit weak credentials makes this a persistent threat.
Understanding the methods used and implementing preventative measures is crucial for SMBs to maintain a secure environment.
Methods of Credential Theft
Attackers employ various techniques to steal credentials. Keyloggers, for example, are malicious software programs that record every keystroke a user makes, including passwords and other sensitive information. These can be installed through phishing emails, infected websites, or even physical devices plugged into computers. Brute-force attacks involve systematically trying numerous password combinations until the correct one is found.
This method is particularly effective against weak or easily guessable passwords. Phishing, as previously discussed, often aims to trick users into revealing their credentials directly. Other methods include exploiting vulnerabilities in software to gain access to password databases or using social engineering tactics to manipulate employees into disclosing their credentials.
Implementing Multi-Factor Authentication (MFA)
Multi-factor authentication (MFA) significantly enhances security by requiring users to provide multiple forms of authentication before accessing systems or accounts. This adds an extra layer of protection, even if one authentication factor is compromised. Common MFA methods include one-time passwords (OTPs) sent via text message or email, biometric authentication (fingerprint or facial recognition), and security tokens. Implementing MFA across all critical systems and accounts should be a top priority for SMBs.
For example, requiring MFA for access to email accounts, cloud storage, and financial systems significantly reduces the risk of unauthorized access, even if an attacker obtains a password.
Creating Strong and Unique Passwords
Creating strong and unique passwords is a fundamental aspect of SMB security. A strong password is long, complex, and difficult to guess. It should include a mix of uppercase and lowercase letters, numbers, and symbols. Password reuse, where the same password is used for multiple accounts, dramatically increases the risk of a widespread breach. If one account is compromised, the attacker gains access to all accounts using that same password.A guide for SMBs on creating strong and unique passwords could include the following recommendations:
- Passwords should be at least 12 characters long.
- Use a mix of uppercase and lowercase letters, numbers, and symbols.
- Avoid using personal information (birthdates, names, etc.) in passwords.
- Do not reuse passwords across multiple accounts.
- Use a password manager to securely store and manage passwords.
- Regularly update passwords, especially for critical accounts.
Implementing these practices, along with MFA, significantly reduces the risk associated with weak or stolen credentials, thereby enhancing overall SMB security. Consider using a password policy enforcement tool to automate password complexity checks and ensure compliance within your organization.
Unpatched Software Vulnerabilities: Top Smb Security Vulnerabilities
Ignoring software updates is like leaving your front door unlocked – it’s an open invitation for trouble. Unpatched software presents a massive security risk for small and medium-sized businesses (SMBs), creating vulnerabilities that cybercriminals actively exploit. Regular patching is crucial for maintaining a secure digital environment and protecting sensitive business data.Regular patching of software and operating systems is paramount for several reasons.
Outdated software often contains known vulnerabilities that hackers can leverage to gain unauthorized access to systems, steal data, install malware, or disrupt operations. Patches address these weaknesses, essentially closing the security gaps before they can be exploited. Ignoring updates leaves your SMB exposed to significant financial and reputational damage.
Identifying and Prioritizing Software Updates
Effective management of software updates requires a structured approach. First, create a comprehensive inventory of all software and operating systems used within the SMB. This includes everything from servers and workstations to applications and network devices. Next, categorize the software based on criticality. High-priority systems, like those handling financial data or customer information, should receive updates immediately.
Low-priority systems can be updated on a less frequent schedule. Finally, utilize automated patching tools where possible to streamline the process and minimize disruption. Consider using a vulnerability scanner to identify outdated software and potential vulnerabilities before they are exploited.
Examples of Vulnerabilities Exploited Due to Unpatched Software
The consequences of neglecting software updates are real and often severe. For example, the infamous WannaCry ransomware attack in 2017 exploited a vulnerability in older versions of Microsoft Windows that had not been patched. This resulted in widespread disruption and significant financial losses for many organizations worldwide. Similarly, the NotPetya ransomware attack leveraged a vulnerability in the outdated software of a Ukrainian accounting firm, spreading globally and causing billions of dollars in damages.
These attacks highlight the devastating impact that unpatched software can have on businesses of all sizes.
Implementing a Regular Software Update Schedule
A well-defined update schedule is essential for maintaining a secure environment. For high-priority systems, aim for immediate patching upon release of critical security updates. For other systems, a weekly or monthly update schedule is recommended, depending on the software and its criticality. Regularly testing updates in a controlled environment (such as a staging server) before deploying them to production systems can help mitigate any potential unforeseen issues.
Finally, establish a clear communication plan to inform employees about scheduled updates and minimize disruption to their workflow. This plan should include regular communication and training to ensure employees understand the importance of keeping software updated.
Lack of Network Security
For small and medium-sized businesses (SMBs), a robust network security strategy isn’t a luxury; it’s a necessity. A poorly secured network opens the door to a multitude of threats, from data breaches and financial losses to reputational damage and legal repercussions. Investing in comprehensive network security is crucial for protecting sensitive business data, maintaining operational continuity, and ensuring customer trust.The importance of a layered security approach cannot be overstated.
This involves implementing multiple security measures that work together to protect your network from various attack vectors. A single point of failure can compromise the entire system, so redundancy and diversification are key.
Firewalls, Intrusion Detection/Prevention Systems (IDS/IPS), and VPNs
Firewalls act as the first line of defense, filtering network traffic and blocking unauthorized access. They examine incoming and outgoing network packets and allow or deny them based on pre-defined rules. Intrusion Detection Systems (IDS) monitor network traffic for malicious activity, alerting administrators to potential threats. Intrusion Prevention Systems (IPS) go a step further, actively blocking malicious traffic.
Virtual Private Networks (VPNs) create secure connections between devices and networks, encrypting data transmitted over public networks, such as the internet, protecting sensitive information from eavesdropping. Implementing these technologies together provides a multi-layered approach to network security, significantly reducing vulnerabilities.
Common Network Security Misconfigurations
Many SMBs suffer from easily avoidable network security misconfigurations. These often stem from a lack of expertise, inadequate training, or simply overlooking crucial security best practices. Common misconfigurations include default passwords on network devices (routers, switches, firewalls), open ports that aren’t necessary for business operations, and failure to enable strong authentication mechanisms like multi-factor authentication (MFA). Another frequent oversight is neglecting to regularly update firmware and software on network devices, leaving them vulnerable to known exploits.
For example, a small retail store might leave its Wi-Fi router with its factory default password, making it an easy target for unauthorized access and potential data theft.
Benefits of Network Segmentation
Network segmentation involves dividing a network into smaller, isolated segments. This limits the impact of a security breach. If one segment is compromised, the attacker’s access is restricted to that specific segment, preventing them from accessing other sensitive parts of the network. This strategy significantly reduces the attack surface and enhances overall security posture. For instance, separating the customer-facing Wi-Fi network from the internal business network prevents a compromised customer network from giving access to sensitive business data.
Network Security Assessment Checklist, Top smb security vulnerabilities
Before implementing any security measures, it’s vital to assess the current state of your network security. This checklist provides a starting point:
- Firewall Configuration: Are firewalls properly configured with up-to-date rules and strong authentication?
- IDS/IPS Deployment: Are intrusion detection/prevention systems in place and actively monitoring network traffic?
- VPN Usage: Is a VPN used for remote access and secure communication?
- Password Policies: Are strong password policies enforced, including regular password changes and multi-factor authentication?
- Network Segmentation: Is the network segmented to limit the impact of potential breaches?
- Software Updates: Are all network devices and software regularly updated with the latest security patches?
- Vulnerability Scanning: Are regular vulnerability scans performed to identify and address security weaknesses?
- Security Awareness Training: Are employees regularly trained on security best practices and phishing awareness?
- Incident Response Plan: Is a comprehensive incident response plan in place to handle security incidents effectively?
- Regular Backups: Are regular backups of critical data performed and stored securely?
Inadequate Data Backup and Recovery
Data loss is a catastrophic event for any small or medium-sized business (SMB). It can lead to lost revenue, damaged reputation, and even business closure. A robust data backup and recovery strategy is not just a good idea; it’s a necessity for survival in today’s digital landscape. Failing to implement one puts your entire operation at significant risk.Regular data backups and a comprehensive disaster recovery plan are crucial for mitigating the impact of data loss from various sources, including hardware failures, cyberattacks, natural disasters, and human error.
A well-defined strategy ensures business continuity and minimizes downtime, allowing for a swift recovery and reduced financial losses.
Backup Strategies
Choosing the right backup strategy depends on factors like budget, data volume, and recovery time objectives (RTOs). A multi-layered approach is often the most effective.
- On-site backups: These backups are stored locally, often on an external hard drive or a network-attached storage (NAS) device. They offer quick access to data but are vulnerable to the same threats as the primary data source (e.g., fire, theft, hardware failure).
- Off-site backups: These backups are stored in a separate location, physically distant from the primary data center. This protects against localized disasters like fires or floods. Common methods include using a secondary office, a secure storage facility, or a secure cloud storage service.
- Cloud-based backups: These backups are stored on servers maintained by a third-party cloud provider. This offers scalability, cost-effectiveness, and protection against many local threats. However, reliance on a third-party introduces potential vendor lock-in and security concerns.
Disaster Recovery Plan Development
A comprehensive disaster recovery plan Artikels the steps to take in the event of a data loss or system failure. It should be a detailed, tested document, not just a theoretical Artikel.
- Risk Assessment: Identify potential threats to your data and systems (e.g., natural disasters, cyberattacks, hardware failures).
- Recovery Time Objectives (RTOs) and Recovery Point Objectives (RPOs): Define acceptable downtime and data loss tolerances. For example, an RTO of 4 hours means the system should be restored within 4 hours of a failure, and an RPO of 24 hours means data loss should not exceed 24 hours.
- Backup and Recovery Procedures: Detail the steps involved in backing up data, restoring data from backups, and recovering systems.
- Testing and Training: Regularly test the disaster recovery plan to ensure its effectiveness and train employees on their roles and responsibilities during a disaster.
- Communication Plan: Artikel how to communicate with employees, customers, and other stakeholders during a disaster.
SMB Data Backup and Recovery Policy
A formal policy ensures consistency and accountability. This example provides a framework; adjust it based on your specific needs.
| Element | Specification |
|---|---|
| Backup Frequency | Full backups weekly, incremental backups daily |
| Backup Media | On-site NAS, off-site cloud storage (e.g., AWS S3, Azure Blob Storage) |
| Retention Policy | Retain 7 daily backups, 4 weekly backups, 12 monthly backups |
| Testing Frequency | Full recovery test quarterly, incremental recovery test monthly |
| Security Measures | Encryption of backups both in transit and at rest; access control lists (ACLs) limiting access to authorized personnel only. |
Lack of Employee Security Awareness Training
Employee security awareness training is often the overlooked cornerstone of a robust SMB security strategy. While technical safeguards like firewalls and antivirus software are crucial, they are only as effective as the people who use them. Human error remains a leading cause of security breaches, making comprehensive training an absolute necessity for mitigating risk and protecting sensitive data.
A well-trained workforce is the first line of defense against sophisticated attacks.Employee training plays a vital role in mitigating security risks by equipping staff with the knowledge and skills to identify and respond to potential threats. This proactive approach reduces the likelihood of successful attacks, minimizes the impact of incidents, and fosters a security-conscious culture within the organization. It’s about empowering employees to become active participants in safeguarding company assets, rather than passive targets.
Effective Security Awareness Training Programs for SMBs
Effective security awareness training programs for SMBs should be engaging, practical, and tailored to the specific needs and roles of employees. Instead of lengthy, dry lectures, consider a blended learning approach combining online modules, interactive exercises, and real-world scenarios. Gamification, using quizzes and simulated phishing attacks, can significantly improve engagement and knowledge retention. Regular refresher training is also crucial, as security threats constantly evolve.
For example, a program might start with an introductory module on general security best practices, followed by more specialized training on topics relevant to specific job roles. For instance, accounting staff would receive training on protecting financial data, while sales staff would learn about safe email practices. Finally, regular phishing simulations can help assess employee awareness and identify areas for improvement.
Key Topics Covered in Employee Security Awareness Training
A comprehensive security awareness training program should cover several key areas. These include:
- Password Security: The importance of strong, unique passwords, password managers, and avoiding password reuse.
- Phishing and Social Engineering: Identifying and reporting suspicious emails, websites, and phone calls. This includes understanding common tactics used by attackers.
- Malware Awareness: Recognizing and avoiding malware infections through safe browsing habits, software updates, and cautious downloads.
- Data Security: Understanding data privacy regulations and best practices for handling sensitive information, including proper data disposal methods.
- Physical Security: Protecting company assets and information from physical threats, such as theft or unauthorized access.
- Social Media Security: Understanding the risks associated with using social media and protecting personal and company information online.
- Mobile Device Security: Safeguarding company data on mobile devices through password protection, secure applications, and regular updates.
- Reporting Security Incidents: Establishing clear procedures for reporting security incidents and suspected breaches.
Sample Security Awareness Training Module: Phishing and Social Engineering
This module focuses on educating employees about phishing and social engineering attacks.
Identifying Phishing Emails
This section would include examples of real-world phishing emails, highlighting common characteristics such as:
- Suspicious sender addresses
- Urgent or threatening language
- Grammar and spelling errors
- Suspicious links or attachments
- Requests for personal information
Employees would be taught to hover over links to see the actual URL before clicking, to be wary of unexpected emails requesting sensitive information, and to report suspicious emails to the IT department immediately.
Recognizing Social Engineering Tactics
This section covers various social engineering techniques, such as pretexting, baiting, and quid pro quo. Employees learn to identify these tactics and how to respond appropriately. For example, a scenario might involve a caller pretending to be from IT, requesting login credentials. The training would emphasize the importance of verifying the caller’s identity through official channels before divulging any sensitive information.
The training would include a role-playing exercise where employees practice responding to such situations.
Responding to Suspicious Activity
This section Artikels the proper procedures for reporting suspicious emails, websites, and phone calls. It emphasizes the importance of not clicking on suspicious links or attachments, and of immediately reporting any suspicious activity to the IT department or designated security personnel. A clear reporting process, including contact information and reporting methods, will be provided.
Physical Security Risks
For small and medium-sized businesses (SMBs), physical security often gets overlooked in favor of more readily apparent digital threats. However, a breach of physical security can have devastating consequences, leading to equipment theft, data loss, and significant financial repercussions. Ignoring physical security vulnerabilities leaves your business exposed to a range of risks that can cripple operations and damage your reputation.Physical security threats to SMBs encompass a wide spectrum of potential dangers.
Theft of valuable equipment, such as computers, servers, and networking hardware, is a primary concern. Vandalism, ranging from minor damage to complete destruction of property, can also disrupt business operations and incur substantial repair costs. Unauthorized access to office spaces, data centers, or server rooms presents a critical vulnerability, allowing intruders to steal sensitive information, plant malware, or sabotage systems.
These threats can significantly impact productivity, profitability, and overall business continuity.
Access Control Systems and Surveillance
Implementing robust access control systems is crucial for limiting physical access to sensitive areas. This could involve keycard systems, biometric scanners, or even simple, well-maintained lock-and-key systems with restricted key distribution. These systems help ensure only authorized personnel can enter restricted areas, significantly reducing the risk of unauthorized access and theft. Similarly, installing a surveillance system with strategically placed cameras acts as a powerful deterrent and provides valuable evidence in case of an incident.
High-quality cameras with recording capabilities offer a comprehensive audit trail, enabling investigation and potentially leading to the apprehension of perpetrators. Consider using a system that allows for remote monitoring and recording access for enhanced security.
Securing Physical Access to Servers and Network Equipment
Servers and network equipment represent the heart of an SMB’s IT infrastructure. Their physical security is paramount. These critical assets should be housed in secure, locked rooms or cages, ideally with environmental controls to prevent overheating and damage. Access to these areas should be strictly controlled, with only authorized personnel possessing access credentials. Regular security audits should be conducted to identify and rectify any vulnerabilities in physical access controls.
Furthermore, consider using tamper-evident seals on server cabinets and network racks to detect unauthorized entry attempts.
Implementing Basic Physical Security Measures
A comprehensive physical security plan for an SMB office environment should encompass several key elements. Firstly, conduct a thorough risk assessment to identify vulnerabilities. This involves evaluating the office layout, identifying potential entry points, and assessing the value of assets located on the premises. Based on this assessment, implement appropriate security measures. This might include installing a robust alarm system with remote monitoring capabilities, reinforcing exterior doors and windows, and improving exterior lighting to deter potential intruders.
Employee training is crucial; educate staff on security protocols, including proper access control procedures, reporting suspicious activity, and the importance of maintaining a secure work environment. Regular security drills and updates to security protocols help ensure that everyone is aware of and prepared for potential threats. Finally, maintaining detailed records of all security-related incidents, including dates, times, and descriptions of events, is essential for tracking trends and identifying areas for improvement.
Outcome Summary
Protecting your SMB from cyber threats requires a multi-faceted approach. It’s not just about installing the latest software; it’s about fostering a culture of security awareness within your team. By understanding the common vulnerabilities and implementing the strategies discussed here – from robust password policies to regular data backups and employee training – you can significantly reduce your risk and build a more resilient business.
Remember, proactive security is an investment, not an expense, and it’s one that will safeguard your future.
FAQ Resource
What is the difference between spear phishing and whaling?
Spear phishing targets specific individuals within an organization, while whaling targets high-profile executives or C-suite members.
How often should I back up my data?
The frequency depends on your business needs, but daily or at least weekly backups are recommended, with offsite copies for disaster recovery.
What is multi-factor authentication (MFA), and why is it important?
MFA adds an extra layer of security beyond just a password, requiring a second form of verification (like a code from your phone) to access accounts, making unauthorized access much harder.
Can I recover my data after a ransomware attack?
Data recovery is possible if you have regular backups stored offline. However, paying the ransom is generally not recommended as it doesn’t guarantee recovery and funds criminal activity.