
-
Information Technology (Indonesia)

Nobel Laureate David Gross Issues Dire Warning: Humanity’s Survival Chances Under 50 Years Amid Escalating Nuclear Threat
Jakarta – A stark and sobering prognosis for humanity’s future has been articulated by Nobel laureate David Gross, the distinguished…
Read More » -
Business & Finance (Indonesia)

Indonesia Stock Exchange Launches Liquidity Provider Program to Boost Market Efficiency and Depth, Marking a New Era for Capital Market Development.
The Indonesia Stock Exchange (IDX) officially commenced the implementation of its Liquidity Provider (LP) stock quotation program on Monday, April…
Read More » -
Software Development
Taming the Legacy Beast: How One Engineering Team Slashed 35% of Their API Codebase Through Intelligent Decommissioning
Eight years of continuous product development had transformed a once-lean Express API into a sprawling digital behemoth, accumulating an unwieldy…
Read More » -
Cybersecurity & Protection
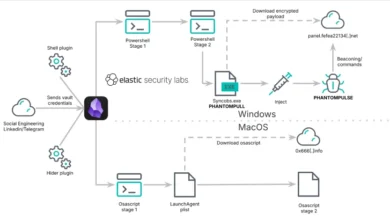
A Novel Social Engineering Campaign Exploits Obsidian Application to Distribute PHANTOMPULSE Remote Access Trojan
A sophisticated and previously undocumented social engineering campaign, identified as REF6598 by Elastic Security Labs, has emerged, leveraging the popular…
Read More » -
Cloud Computing
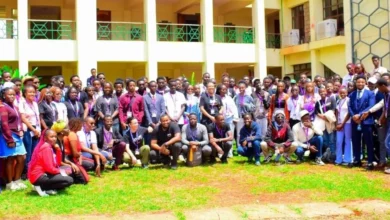
AWS Student Community Empowers Next Generation of Cloud Innovators in Kenya with Engaging Events and Skill-Building Opportunities
The AWS Student Community in Kenya recently concluded a dynamic series of events, culminating in a highly successful AWS Student…
Read More » -
Cloud Computing

Google Cloud Unveils QueryData to Revolutionize AI Agent Database Interactions, Promising Near-Perfect Accuracy Amidst Design Complexity
A new tool from Google Cloud, QueryData, is poised to significantly enhance the accuracy and reliability of AI agents when…
Read More » -
Cloud Computing
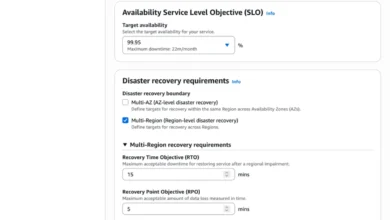
AWS Resilience Hub Unveils Next Generation with Advanced Application Modeling, Dependency Discovery, and AI-Powered Failure Analysis
The next generation of AWS Resilience Hub has been announced, introducing a significantly expanded experience that integrates a new application…
Read More » -
Artificial Intelligence

Stanford University Physicists Develop Scalable Optical Cavity Architecture to Accelerate Quantum Computing Networks and Qubit Readout Efficiency
The pursuit of a functional, large-scale quantum computer has long been hindered by the dual challenges of qubit stability and…
Read More » -
Mobile Application Development
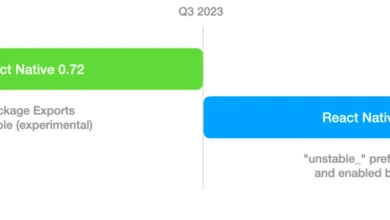
React Native 0.72 Introduces Beta Support for Package Exports in Metro Bundler to Enhance Ecosystem Compatibility
React Native 0.72 marks a significant milestone in the evolution of the mobile framework’s development experience, introducing beta support for…
Read More » -
Indonesian National News

Bulog Rejang Lebong Exceeds Annual Paddy Absorption Target, Bolstering Regional Food Security and Farmer Welfare
Perum Bulog Kantor Cabang Rejang Lebong in Bengkulu Province has significantly surpassed its annual target for paddy absorption, recording an…
Read More »
