How to Better Analyze Your Marketing Performance with Unica Insights Reports
How to better analyze your marketing performance with Unica Insights reports? It’s a question every marketer wrestles with. Unlocking the power of Unica Insights isn’t just about generating reports; it’s about transforming raw data into actionable strategies. This post dives deep into mastering Unica Insights, showing you how to identify key performance indicators (KPIs), analyze campaign effectiveness, and ultimately, boost your marketing ROI.
We’ll explore different report types, data visualization techniques, and even offer practical tips for making data-driven decisions that truly impact your bottom line.
We’ll cover everything from understanding the various report types available in Unica Insights and their key metrics, to building effective dashboards that showcase your most important KPIs. Learn how to identify areas for improvement in your campaigns, optimize your marketing spend, and segment your audience for more effective targeting. By the end, you’ll be equipped to leverage Unica Insights to its full potential, driving better results and making your marketing efforts significantly more efficient.
Understanding Unica Insights Reports: How To Better Analyze Your Marketing Performance With Unica Insights Reports
Unica Insights offers a suite of reporting tools designed to help marketers analyze their campaign performance and optimize their strategies. Understanding the different report types and the key metrics they present is crucial for extracting actionable insights. This guide will walk you through the various reports, highlighting their key features and how to interpret the data they provide.
Unica Insights Report Types and Key Metrics
Unica Insights provides several report types, each offering a unique perspective on marketing campaign performance. These reports are tailored to provide different levels of detail and focus on specific aspects of a campaign’s success. The selection of the right report depends on the specific questions you need to answer.
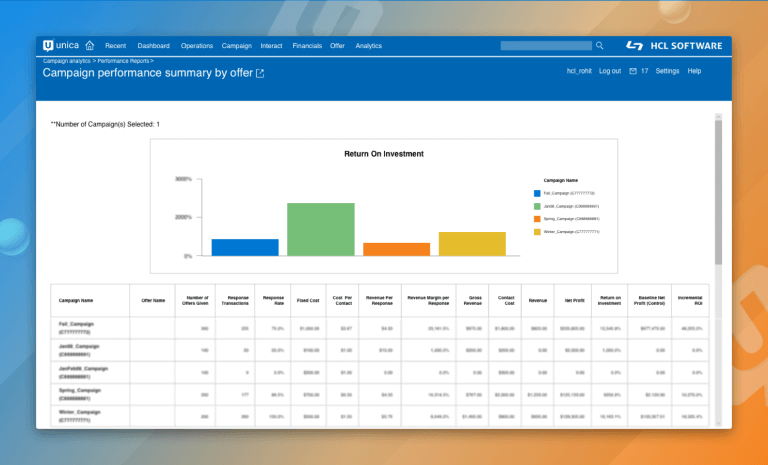
Campaign Performance Report
This report provides a comprehensive overview of a campaign’s overall effectiveness. Key metrics include:
- Total Recipients: The total number of individuals who received the campaign message.
- Opens: The number of recipients who opened the email or viewed the message.
- Clicks: The number of recipients who clicked on a link within the campaign message.
- Conversions: The number of recipients who completed a desired action, such as making a purchase or filling out a form.
- Bounce Rate: The percentage of emails that were not delivered due to invalid email addresses or other delivery issues.
- Open Rate: The percentage of recipients who opened the email (Opens / Total Recipients).
- Click-Through Rate (CTR): The percentage of recipients who clicked on a link (Clicks / Total Recipients).
- Conversion Rate: The percentage of recipients who completed a desired action (Conversions / Total Recipients).
Interpreting the data: A high open rate combined with a low click-through rate might suggest that the email subject line was effective, but the email content wasn’t compelling enough. Conversely, a low open rate and high click-through rate might indicate issues with deliverability or subject line effectiveness.
Audience Segmentation Report
This report analyzes campaign performance across different audience segments. Key metrics include:
- Segment Performance: Open rates, click-through rates, and conversion rates for each defined audience segment.
- Segment Size: The number of recipients within each segment.
- Segment Demographics: Relevant demographic information for each segment (e.g., age, location, gender).
Interpreting the data: Comparing the performance of different segments can reveal which segments are most responsive to your campaigns, allowing for more targeted future efforts. For example, if the “high-value customer” segment shows significantly higher conversion rates, future campaigns should prioritize this group.
Channel Performance Report
This report shows the effectiveness of different marketing channels used in a campaign. Key metrics include:
- Channel-Specific Metrics: Open rates, click-through rates, and conversion rates for each channel (e.g., email, SMS, social media).
- Cost per Acquisition (CPA): The cost of acquiring a customer through each channel.
- Return on Investment (ROI): The return on investment for each channel.
Interpreting the data: By analyzing channel performance, marketers can identify the most cost-effective channels and allocate resources accordingly. A high ROI from email marketing, for instance, suggests a need for increased investment in this channel.
Comparison of Unica Insights Reports
| Report Type | Key Metrics | Data Visualization | Use Cases |
|---|---|---|---|
| Campaign Performance Report | Opens, Clicks, Conversions, Bounce Rate, Open Rate, CTR, Conversion Rate | Charts, graphs, tables | Overall campaign effectiveness analysis, identifying areas for improvement |
| Audience Segmentation Report | Segment Performance, Segment Size, Segment Demographics | Charts, graphs, segmented tables | Identifying high-performing segments, tailoring campaigns to specific audiences |
| Channel Performance Report | Channel-Specific Metrics, CPA, ROI | Charts, graphs, comparative tables | Optimizing channel allocation, identifying most cost-effective channels |
Identifying Key Performance Indicators (KPIs)
Choosing the right metrics to track is crucial for understanding your marketing performance. Without carefully selected KPIs, your analysis might be misleading, leading to ineffective resource allocation and missed opportunities. This section focuses on best practices for identifying and utilizing KPIs within the Unica Insights platform.
Effective KPI selection hinges on aligning them directly with your overarching marketing objectives. If your goal is to increase brand awareness, focusing solely on sales conversions might obscure valuable insights into the effectiveness of your brand-building activities. Conversely, if your primary aim is driving immediate sales, ignoring website traffic or lead generation might provide an incomplete picture of your marketing ROI.
Selecting Relevant KPIs Based on Marketing Objectives
The key to selecting the right KPIs is a clear understanding of your marketing goals. For example, a company launching a new product might prioritize metrics like website traffic, lead generation, and conversion rates. An established company focusing on customer retention might concentrate on metrics like customer lifetime value (CLTV), churn rate, and customer satisfaction scores. Unica Insights allows you to easily track these and many other metrics, providing a granular view of performance across various channels.
Limitations of Vanity Metrics
Vanity metrics, such as likes, shares, or follower counts on social media, can be alluring but often fail to reflect true marketing success. While they might boost your ego, they rarely translate directly into revenue or other meaningful business outcomes. For instance, a high number of social media followers doesn’t automatically guarantee increased sales. Instead, focus on metrics that demonstrate a clear connection to your business goals, such as engagement rate (interactions divided by reach), click-through rates (CTR) from social media ads leading to your website, and ultimately, conversions from those website visits.
Tracking Marketing Channel Effectiveness Using Unica Insights Data, How to better analyze your marketing performance with unica insights reports
Unica Insights provides the tools to analyze the effectiveness of different marketing channels. By attributing conversions and other key actions to specific campaigns and channels, you can identify which strategies are delivering the best results and optimize your resource allocation accordingly. For example, you can compare the ROI of email marketing campaigns versus social media advertising by tracking conversions originating from each channel.
This data-driven approach enables you to make informed decisions about where to invest your marketing budget for maximum impact. Unica’s reporting capabilities allow for detailed segmentation and analysis, allowing for a deeper understanding of which customer segments respond best to which channels.
Sample KPI Dashboard
A well-designed dashboard provides a clear and concise overview of your key marketing performance indicators. Here’s an example of a dashboard showcasing key KPIs, visualized using Unica Insights’ reporting features:
- Website Traffic: A line graph showing website visits over time, segmented by traffic source (organic, paid, social media, etc.). This visualization helps identify trends and the effectiveness of different acquisition strategies.
- Conversion Rate: A bar chart comparing conversion rates across different marketing channels (email, social media, search engine marketing, etc.). This provides a clear picture of which channels are most effective at driving conversions.
- Customer Acquisition Cost (CAC): A table showing the CAC for each marketing channel. This allows for a direct comparison of the cost-effectiveness of different strategies.
- Customer Lifetime Value (CLTV): A pie chart showing the distribution of CLTV across different customer segments. This helps identify high-value customer segments and inform retention strategies.
- Return on Ad Spend (ROAS): A bar chart comparing ROAS across different advertising campaigns. This helps optimize ad spending by identifying high-performing campaigns and weeding out underperforming ones.
Analyzing Campaign Performance

Unica Insights reports offer a powerful way to dissect the effectiveness of your marketing campaigns. By moving beyond simple open rates and click-throughs, you can gain a deeper understanding of what resonates with your audience and what needs improvement. This analysis allows for data-driven optimization, leading to better ROI and more impactful future campaigns.This section will guide you through analyzing campaign performance using Unica Insights data, focusing on comparative analysis, identifying areas for improvement, structuring data hierarchically, and leveraging the data for audience segmentation.
Campaign Performance Comparison
Comparing the performance of multiple campaigns reveals valuable insights into what works and what doesn’t. Unica Insights allows you to juxtapose key metrics across different campaigns, facilitating a direct comparison of their effectiveness. For instance, you might compare two email campaigns promoting the same product but with different subject lines or creative assets. By analyzing metrics like click-through rates, conversion rates, and cost per acquisition (CPA) across these campaigns, you can pinpoint the most successful elements and replicate them in future initiatives.
A visual representation, such as a bar chart showing the conversion rates for each campaign, would make this comparison immediately clear.
Identifying Areas for Improvement
Once you’ve compared campaigns, identifying areas for improvement is crucial. Unica Insights provides granular data allowing you to pinpoint weaknesses. For example, a low conversion rate despite a high click-through rate might suggest a problem with the landing page or the post-click experience. Similarly, a low open rate could point to ineffective subject lines or poor email deliverability.
By examining these specific metrics in conjunction with overall campaign performance, you can create a targeted action plan to address these weaknesses. For example, A/B testing different subject lines in future campaigns could directly address a low open rate issue.
Hierarchical Structure of Campaign Performance Data
Organizing campaign performance data hierarchically helps to visualize the overall picture and identify top and bottom performers. You might start with a high-level overview showing the overall performance of each campaign. Then, drill down into individual campaign elements, such as specific email sends or landing pages, to pinpoint the most successful and least successful aspects. This hierarchical view allows for a clear understanding of which aspects of your campaigns are contributing most significantly to your overall marketing goals.
For instance, a hierarchical structure could start with a summary of campaign performance, followed by a breakdown of performance by channel (email, social media, etc.), and finally a detailed view of individual creative assets within each channel.
Audience Segmentation Based on Unica Insights Data
Unica Insights provides rich data for audience segmentation, enabling you to target your marketing efforts more effectively. By analyzing campaign data, you can identify specific segments that responded positively or negatively to your campaigns. This information allows you to refine your targeting criteria and tailor your messaging to resonate more effectively with specific audience groups. For example, if you find that a specific demographic segment has a significantly higher conversion rate, you can prioritize targeting future campaigns towards that segment.
This precision targeting can significantly improve campaign ROI and reduce wasted marketing spend.
Improving Marketing ROI with Unica Insights

Unica Insights offers a powerful toolkit for boosting your marketing ROI. By leveraging its data-rich reports, you can move beyond guesswork and make informed decisions that optimize your marketing spend and drive significant improvements in conversion rates. This allows for a more efficient allocation of resources and a clearer understanding of what truly resonates with your target audience.
Unica Insights provides a comprehensive view of your marketing campaigns, allowing you to pinpoint areas of strength and weakness. This granular level of detail empowers you to refine your strategies, maximizing your return on investment and ensuring that every marketing dollar is working as hard as it can.
Optimizing Marketing Spend with Unica Insights Data
Unica Insights allows for precise analysis of campaign performance across various channels. For example, imagine a scenario where email marketing consistently underperforms compared to social media campaigns. By examining the Unica Insights reports, you might discover a low click-through rate on your email subject lines. This data points to a need for A/B testing different subject lines to improve engagement.
Unlocking deeper marketing insights with Unica’s reports is key, especially when you’re aiming for data-driven decisions. To really optimize your campaigns, consider how efficiently you can build and deploy those applications; check out this article on domino app dev the low code and pro code future for some innovative solutions. Ultimately, streamlining your app development process can free up more time to focus on analyzing your Unica reports and refining your marketing strategies for even better results.
Alternatively, you might find that a particular social media platform is driving significantly higher conversion rates than others, suggesting a reallocation of budget towards that platform. Such insights allow for the strategic shifting of resources, maximizing the effectiveness of your marketing efforts and minimizing wasted spend.
Strategies for Improving Conversion Rates Based on Unica Insights Report Analysis
Analyzing Unica Insights data reveals crucial insights into customer behavior and preferences. Let’s say the reports show a high bounce rate on a specific landing page. This suggests that the page content, design, or call to action isn’t effectively engaging visitors. By examining the data further, you can identify specific elements contributing to the high bounce rate and make targeted improvements.
For instance, you might simplify the page’s navigation, improve the clarity of your messaging, or optimize the placement of your call-to-action button. This data-driven approach allows for continuous improvement and optimization of your conversion funnel. Similarly, identifying the most effective customer segments through Unica Insights allows for more targeted messaging and offers, leading to improved conversion rates.
A Step-by-Step Guide to Data-Driven Decision Making with Unica Insights
- Define Objectives: Clearly Artikel your marketing goals. What are you trying to achieve? Increased brand awareness? Higher conversion rates? Improved customer loyalty?
- Identify Relevant KPIs: Select the key performance indicators that align with your objectives. This might include website traffic, conversion rates, click-through rates, customer acquisition cost, and return on investment.
- Analyze Unica Insights Reports: Carefully review the data presented in the reports. Pay attention to trends, patterns, and anomalies. Look for areas where performance is exceeding expectations and areas needing improvement.
- Develop Data-Driven Strategies: Based on your analysis, develop specific strategies to address identified areas for improvement. This might involve A/B testing different ad creatives, refining your targeting parameters, or optimizing your website’s user experience.
- Implement and Monitor: Put your strategies into action and continuously monitor their performance using Unica Insights. Track your progress and make adjustments as needed.
Tracking the Customer Journey and Identifying Areas for Improvement with Unica Insights
Unica Insights provides a holistic view of the customer journey, from initial interaction to final conversion. By analyzing data across various touchpoints, you can identify bottlenecks and friction points that hinder the customer experience. For instance, if you notice a significant drop-off in the conversion funnel between adding items to a shopping cart and completing the purchase, it suggests a problem with the checkout process.
This could be due to complicated navigation, lack of payment options, or a lack of clear instructions. By identifying these areas of friction, you can implement targeted improvements to streamline the customer journey and improve conversion rates. Analyzing the data also allows you to better understand which marketing channels are most effective at attracting and engaging customers at different stages of their journey.
Final Wrap-Up
Mastering Unica Insights is about more than just understanding the reports; it’s about developing a data-driven mindset. By learning to interpret the data effectively, identify key KPIs, and visualize your findings in compelling ways, you can transform your marketing strategy. Remember, the insights you gain from Unica Insights aren’t just numbers; they’re the roadmap to improved campaign performance, optimized spending, and a higher return on your marketing investment.
So dive in, explore the possibilities, and start making data-driven decisions that drive real results!
Frequently Asked Questions
What if my Unica Insights data seems inaccurate?
Double-check your data sources and ensure they are correctly integrated with Unica Insights. Contact Unica support if you suspect a system error.
How often should I review my Unica Insights reports?
Regular review is key! Aim for at least weekly, or even daily for critical campaigns, to stay on top of performance and make timely adjustments.
Can I customize my Unica Insights dashboards?
Yes, most Unica Insights platforms allow for dashboard customization to focus on your most relevant KPIs and metrics.
What if I don’t understand a specific metric in a report?
Consult Unica’s documentation or support for clarification on any unfamiliar metrics. Many platforms offer definitions and explanations within the report itself.