How to Build Dynamic Dashboards An Introduction
How to build dynamic dashboards an introduction – How to build dynamic dashboards: an introduction sets the stage for a journey into the exciting world of interactive data visualization. Forget static reports; we’re diving into the creation of dashboards that respond to user interactions, update in real-time, and offer unparalleled insights. This isn’t just about pretty charts; it’s about building powerful tools that transform raw data into actionable intelligence, driving better decisions and boosting efficiency across various industries.
Get ready to learn the essentials, from choosing the right tools and integrating your data to designing intuitive interfaces and ensuring security.
We’ll cover everything from defining what makes a dynamic dashboard truly dynamic – think interactive filters, drill-downs, and real-time updates – to exploring the various tools and technologies available for building them. Whether you’re a seasoned developer or a complete beginner, this introduction will equip you with the foundational knowledge and practical steps needed to embark on your dynamic dashboard building adventure.
We’ll tackle data sources, integration techniques, design considerations, and best practices for security and maintenance, making sure you have a solid understanding of the entire process.
Defining Dynamic Dashboards
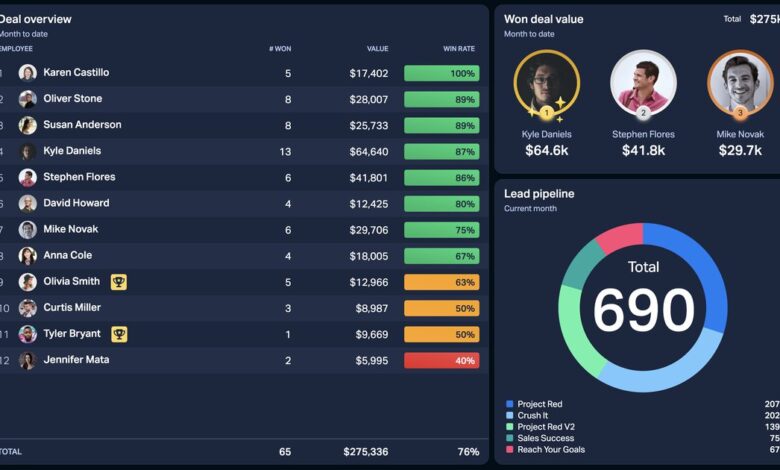
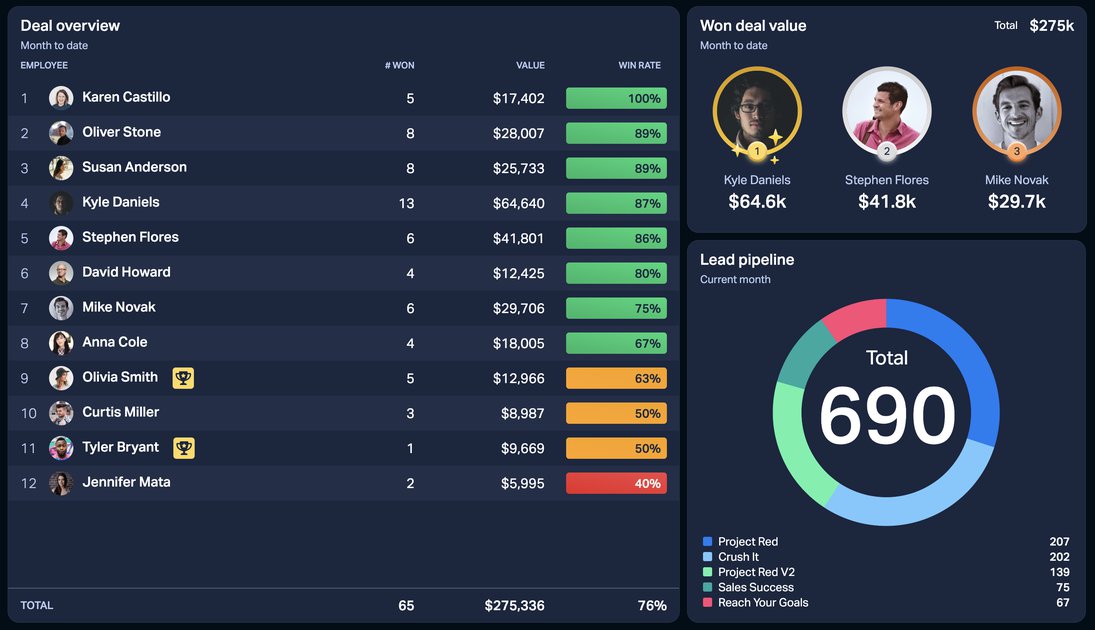
Dynamic dashboards are the powerhouse of modern data visualization, offering a significant upgrade over their static counterparts. Unlike static dashboards, which present a fixed snapshot of data at a specific point in time, dynamic dashboards adapt and respond to user interactions and changes in the underlying data. This responsiveness allows for deeper data exploration and more insightful analysis. The key is their ability to update in real-time, offering a continuously evolving view of key performance indicators (KPIs) and trends.Dynamic dashboards offer several advantages over static ones.
The interactive nature allows users to drill down into specific data points, filter information based on various criteria, and customize the view to focus on what’s most relevant to their needs. This empowers users to uncover hidden patterns and trends that might be missed in a static presentation. The real-time updates ensure that decisions are always based on the most current information, crucial in fast-paced environments.
Types of Dynamic Dashboards
Dynamic dashboards are incredibly versatile and find application across a wide range of industries. Their adaptability allows them to be tailored to specific needs and data sources. Examples include operational dashboards for monitoring real-time production metrics in manufacturing, financial dashboards displaying live market data and investment performance, and marketing dashboards tracking campaign performance and customer engagement. These dashboards are not just visual; they are interactive tools facilitating better decision-making.
Use Cases and Advantages of Dynamic Dashboards
The advantages of using dynamic dashboards are numerous and impactful. Consider a retail company using a dynamic dashboard to monitor sales data across various stores and product lines. The dashboard could show real-time sales figures, inventory levels, and customer demographics. If sales of a particular product drop significantly in a specific region, the dashboard immediately highlights this issue, allowing the company to react quickly with targeted promotions or adjustments to inventory.
This proactive approach, enabled by the dynamic nature of the dashboard, prevents potential losses and optimizes resource allocation.Another example is a healthcare provider using a dynamic dashboard to monitor patient vital signs in real-time. This enables immediate detection of critical changes, allowing for prompt medical intervention. The dynamic update feature ensures that medical professionals have access to the most current information, potentially saving lives.
Such dashboards are indispensable in emergency rooms and intensive care units. In these scenarios, the speed and accuracy of information are paramount.Finally, consider a logistics company using a dynamic dashboard to track shipments in real-time. The dashboard displays the location of each shipment, estimated delivery times, and potential delays. This allows the company to proactively address potential problems, optimize delivery routes, and improve customer satisfaction.
Predictive analytics integrated into the dashboard can even forecast potential disruptions, allowing for proactive mitigation strategies.
Essential Components of Dynamic Dashboards
Building a truly effective dynamic dashboard requires more than just throwing some charts together. It’s about carefully selecting and integrating key components to create a powerful tool for data analysis and decision-making. A well-designed dashboard provides a clear, concise, and interactive view of your key performance indicators (KPIs), allowing for quick identification of trends and anomalies. Let’s explore the essential building blocks.
Key Components of Dynamic Dashboards
The following table Artikels the crucial components of a robust dynamic dashboard. Each element plays a vital role in ensuring the dashboard is not only visually appealing but also functional and insightful.
| Component Name | Description | Example | Importance |
|---|---|---|---|
| Data Source | The origin of the data powering the dashboard. This could be a database, spreadsheet, API, or other data source. | A SQL database containing sales figures, a CSV file with website traffic data, or a real-time data stream from sensors. | Fundamental; without data, the dashboard is useless. The reliability and accessibility of the data source directly impact the dashboard’s accuracy and performance. |
| Data Processing Engine | The system responsible for cleaning, transforming, and aggregating raw data into a usable format for visualization. | A Python script using Pandas and other libraries to perform data manipulation, or a cloud-based ETL (Extract, Transform, Load) service. | Crucial for data accuracy and efficiency. Proper data processing ensures the dashboard displays meaningful insights, rather than raw, uninterpretable data. |
| Visualization Layer | The component responsible for presenting the processed data in a visually appealing and understandable manner. This includes charts, graphs, maps, and other visual elements. | Interactive line charts showing sales trends over time, geographical heatmaps displaying customer density, or gauge charts indicating key performance metrics. | Essential for conveying insights quickly and effectively. Choosing the right visualization type is crucial for clear communication of data. |
| Interactive Elements | Features that allow users to interact with the dashboard, such as filters, drill-downs, and zoom capabilities. | Sliders to adjust date ranges, dropdowns to select different metrics, or click-to-zoom functionality on maps. | Enhances user experience and allows for deeper data exploration. Interactive elements empower users to customize their view and gain more specific insights. |
The Role of Data Visualization
Data visualization is the heart of a dynamic dashboard. It transforms raw data into easily digestible insights, allowing users to quickly understand complex information. Effective visualization is crucial for making data-driven decisions. Different chart types serve different purposes. For example:* Line charts: Ideal for showing trends over time, such as website traffic or sales figures.
Bar charts
Useful for comparing different categories, such as sales performance across different regions.
Scatter plots
Effective for identifying correlations between two variables, such as advertising spend and sales revenue.
Pie charts
Suitable for showing proportions of a whole, such as market share or customer demographics.
Heatmaps
Excellent for visualizing large datasets with geographical or temporal dimensions, highlighting areas of high or low concentration.Choosing the appropriate chart type is critical for clear communication. A poorly chosen chart can obscure insights, while a well-chosen chart can highlight crucial trends and patterns.
Conceptual Architecture of a Dynamic Dashboard System
Imagine a simple system:[Diagram Description: A box labeled “Data Source” connects to a box labeled “Data Processing Engine” with an arrow indicating data flow. The “Data Processing Engine” then connects to a box labeled “Visualization Layer” with another arrow indicating data flow. Finally, the “Visualization Layer” connects to a box labeled “User Interface” (representing the dashboard displayed to the user) with an arrow.
The “User Interface” has a feedback loop (another arrow) going back to the “Data Processing Engine”, indicating user interactions influencing data processing and display.]The Data Source provides the raw data. The Data Processing Engine cleans, transforms, and prepares this data for visualization. The Visualization Layer translates the processed data into charts and graphs. Finally, the User Interface displays this information to the user, allowing for interaction that feeds back into the data processing engine, allowing for dynamic updates and filtering.
This feedback loop is what makes the dashboard truly “dynamic”.
Data Sources and Integration
Building dynamic dashboards hinges on the seamless integration of data from various sources. The power of a dynamic dashboard lies in its ability to present a unified view of information scattered across different systems, providing a holistic understanding of key performance indicators (KPIs) and trends. Choosing the right data sources and implementing effective integration techniques are crucial for building a truly valuable and insightful dashboard.Data sources for dynamic dashboards are incredibly diverse, each presenting unique challenges and opportunities.
Understanding these differences and choosing the right integration methods is paramount for success.
Data Source Types
Dynamic dashboards can draw data from a wide range of sources. These include relational databases (like MySQL, PostgreSQL, or SQL Server), NoSQL databases (like MongoDB or Cassandra), cloud-based data warehouses (such as Snowflake or Google BigQuery), APIs (Application Programming Interfaces) that expose data from various applications and services, spreadsheets (like Excel or Google Sheets), and even CSV files. Each source requires a different approach to data integration.
For example, a relational database will require SQL queries to extract data, while an API might require using HTTP requests and understanding its specific data format (like JSON or XML). Spreadsheets, while simple to use, often lack the scalability and data governance features of dedicated databases.
Data Integration Techniques
Several techniques exist for integrating data from these diverse sources. The most common include:
- Direct Database Connections: This involves establishing a direct connection to a database using database drivers and query languages like SQL. This is efficient for large, structured datasets residing in relational databases. The connection is typically managed by the dashboarding tool itself, which handles data retrieval and processing. For example, Tableau or Power BI directly connect to databases via ODBC or JDBC drivers.
- API Integrations: APIs allow access to data from external applications and services. The dashboarding tool uses HTTP requests to fetch data from the API endpoint, often requiring parsing of the response (e.g., JSON or XML) before it can be used in the dashboard. A common example is integrating sales data from a Shopify store using their API.
- ETL (Extract, Transform, Load): This is a robust process for handling complex data integration needs. Data is extracted from various sources, transformed to a consistent format, and then loaded into a data warehouse or a data lake. This is ideal for large-scale data integration projects requiring significant data cleaning and transformation. Tools like Informatica PowerCenter or Apache Kafka are frequently used for ETL processes.
- File-Based Integration: This involves importing data from files such as CSV, Excel, or JSON. This is a simpler method suitable for smaller datasets or infrequent updates. However, it can be less efficient for large or frequently updated datasets compared to direct database connections or API integrations.
Challenges in Data Integration and Solutions
Data integration often presents several challenges. Data inconsistencies across different sources (different formats, naming conventions, data types) are common. Data quality issues, such as missing values or outliers, also require careful handling. Real-time data integration can be complex, demanding high performance and scalability. Security is also paramount, especially when dealing with sensitive data.To address these challenges, consider the following solutions:
- Data Cleaning and Transformation: Implementing robust data cleaning and transformation procedures before integrating the data into the dashboard is crucial. This might involve handling missing values, standardizing data formats, and resolving inconsistencies.
- Data Governance and Standardization: Establish clear data governance policies and standards to ensure data consistency and quality across all sources. This includes defining data dictionaries, data quality rules, and data access controls.
- Real-time Data Streaming: For real-time dashboards, utilize technologies like Apache Kafka or other message brokers to handle high-volume, high-velocity data streams. This enables near real-time updates to the dashboard.
- Secure Data Access: Implement appropriate security measures, such as encryption and access controls, to protect sensitive data during the integration process. Use secure protocols and authentication methods for all data connections.
Dashboard Development Tools and Technologies
Building dynamic dashboards requires the right tools. The choice depends heavily on your technical skills, budget, and the complexity of your data and visualizations. Fortunately, a wide range of options cater to various needs, from no-code platforms perfect for beginners to robust coding environments for experienced developers.
Categorization of Dashboard Development Tools
Selecting the appropriate tool hinges on understanding the different approaches available. The tools can be broadly categorized into three main groups based on their development methodology: no-code, low-code, and code-based solutions. Each offers a unique balance between ease of use and customization flexibility.
- No-Code: These platforms require no programming knowledge. They offer drag-and-drop interfaces and pre-built templates, making them ideal for users with limited technical skills. Examples include Tableau Prep Builder and Power BI Desktop.
- Low-Code: These platforms minimize the amount of coding required, allowing users to build dashboards with minimal programming. They typically offer a combination of visual tools and scripting capabilities, providing more flexibility than no-code solutions. Examples include Microsoft Power Apps and Google Data Studio.
- Code-Based: These tools require significant programming skills and often involve writing custom code to build dashboards. They provide maximum flexibility and control but require a steep learning curve. Examples include frameworks like D3.js, React, and Angular, often used in conjunction with backend technologies like Python (with libraries such as Flask or Django) and databases.
Comparison of Dashboarding Tools
Choosing the right tool involves considering several factors. Below is a comparison of three popular dashboarding tools representing different approaches: Tableau, Power BI, and Google Data Studio.
| Feature | Tableau | Power BI | Google Data Studio |
|---|---|---|---|
| Ease of Use | High, intuitive drag-and-drop interface | High, user-friendly interface with good tutorials | High, simple drag-and-drop interface, but can be limited for complex dashboards |
| Data Connectivity | Excellent, supports a wide range of data sources | Excellent, connects to various databases and cloud services | Good, integrates well with Google services but may require workarounds for others |
| Visualization Capabilities | Extensive, offers a wide range of charts and graphs | Extensive, similar to Tableau with strong interactive features | Good, offers a solid selection of visualizations but fewer advanced options |
| Cost | Subscription-based, various pricing tiers available | Subscription-based, various pricing tiers available | Freemium model, basic features are free, advanced features require a paid subscription |
| Customization | High, allows for extensive customization through scripting and calculated fields | High, allows for extensive customization, especially with Power BI Desktop | Moderate, customization options are more limited compared to Tableau and Power BI |
Connecting a Data Source to Google Data Studio
This example demonstrates connecting a Google Sheet to Google Data Studio. This is a simple, readily available data source for illustration.Google Data Studio excels at integrating with other Google services. To connect a Google Sheet, you would first create a new data source within Google Data Studio. You select “Google Sheets” as the data source type and then authorize Data Studio to access your Google Drive.
After selecting the specific Google Sheet, Data Studio will automatically import the data. You can then use this data to create charts, tables, and other visualizations within your dashboard. This seamless integration simplifies the process for users familiar with the Google ecosystem. For other data sources, you might need to use connectors or import data in a compatible format like CSV.
Designing Interactive Elements
Interactive elements are the heart of a dynamic dashboard. They transform static data displays into engaging, insightful tools that empower users to explore data at their own pace and uncover hidden patterns. Without well-designed interactivity, even the most meticulously curated data can feel overwhelming and ultimately, useless. The key is to provide intuitive controls that allow users to filter, sort, and delve deeper into the information, all while maintaining a clear and uncluttered visual presentation.The importance of user interface (UI) and user experience (UX) design in dynamic dashboards cannot be overstated.
A poorly designed interface, no matter how powerful the underlying data, will lead to frustration and ultimately, disengagement. Conversely, a well-designed dashboard, intuitive and easy to navigate, will encourage exploration and deeper understanding of the data. This translates to better decision-making and a higher return on investment for the time and resources spent building the dashboard. Consider the dashboard as a conversation with the user; it should be a clear, concise, and engaging dialogue, not a confusing monologue.
Filter Implementation
Filters are arguably the most crucial interactive element in a dynamic dashboard. They allow users to narrow down the displayed data based on specific criteria. For example, a sales dashboard might allow users to filter sales data by region, product category, or time period. Effective filter design involves careful consideration of the available data and the likely needs of the users.
A well-designed filter will be easy to use, providing clear labels and intuitive controls. Avoid overwhelming users with too many filters at once; prioritize the most commonly used ones. Consider using dropdown menus for categorical data and sliders or date pickers for numerical or temporal data.
Drill-Down Functionality
Drill-down functionality allows users to progressively explore data at increasing levels of detail. Imagine a dashboard showing overall sales figures. A drill-down feature would allow a user to click on a specific region to see sales figures broken down by product category within that region, and then further drill down to individual sales representatives. This progressive exploration is essential for uncovering trends and insights that might be hidden at a higher level of aggregation.
Visually, this could be implemented with collapsible sections or expanding charts that reveal more granular data upon interaction. Clear visual cues, such as plus and minus icons or expanding arrows, are crucial for guiding users through the drill-down process.
Slider Controls
Sliders are an excellent way to allow users to interactively explore data ranges. For instance, a financial dashboard might use sliders to filter transactions based on a specified amount or a time period. Sliders offer a visual and intuitive way to adjust parameters, providing immediate feedback as the data updates. The design should be clear, with clear labels indicating the minimum and maximum values, and a visual representation of the current selected range.
Consider adding tooltips to display the exact value selected by the slider, enhancing user understanding.
Example Interactive Dashboard Elements using HTML
A simple example of a filter using HTML and JavaScript could be a dropdown menu for selecting a region: This dropdown allows users to select a region, triggering a JavaScript function (not shown here) to update the displayed data accordingly. A slider could be implemented using a range input: This allows users to adjust a sales amount range, updating the displayed data and the label dynamically using JavaScript.
These simple examples demonstrate how HTML can be used to create basic interactive elements. More sophisticated interactions often require the use of JavaScript libraries or frameworks like D3.js or React.js to handle complex data manipulation and visual updates.
Implementing Dynamic Updates and Real-time Data
Bringing your dashboard to life involves much more than just static visualizations. The true power of a dynamic dashboard lies in its ability to reflect real-time changes in your data, providing an up-to-the-minute view of key performance indicators (KPIs) and trends. This responsiveness is crucial for informed decision-making, especially in fast-paced environments. This section explores the methods and technologies enabling these real-time updates.Real-time data updates significantly enhance the value and utility of a dynamic dashboard.
Instead of relying on periodic refreshes, which can introduce lag and outdated information, real-time updates provide a continuous stream of fresh data, enabling users to react immediately to changes and trends. This is achieved through a combination of efficient data transfer protocols and well-designed data processing pipelines.
WebSockets for Real-time Communication
WebSockets offer a persistent, bidirectional communication channel between the client (the dashboard) and the server (the data source). Unlike traditional HTTP requests, which require a new connection for each update, WebSockets maintain a single, open connection, allowing for efficient and low-latency data transmission. This makes them ideal for applications requiring constant data streaming, such as stock tickers, live sales dashboards, or monitoring systems.
A WebSocket connection establishes a continuous stream of data from the server to the client, pushing updates as they occur without the client needing to explicitly request them. This contrasts with polling, which we will discuss next.
Polling for Periodic Data Updates
Polling involves the client periodically sending requests to the server to check for updates. While simpler to implement than WebSockets, polling is less efficient. The frequency of polling needs to be carefully balanced; too frequent, and it wastes resources; too infrequent, and you lose the real-time aspect. Polling is suitable for applications where real-time requirements are less stringent or where the overhead of establishing and maintaining WebSocket connections is undesirable.
Consider a dashboard displaying website traffic data updated every minute. This could easily be implemented with polling, as a one-minute delay is often acceptable.
A Conceptual Workflow for Real-time Data Updates
A robust real-time dashboard requires a well-defined workflow. First, data is ingested from the source (database, API, sensor, etc.). This data is then processed, cleaned, and transformed into a format suitable for visualization. This often involves aggregation, filtering, and calculations. The processed data is then transmitted to the dashboard client using a chosen method (WebSockets or polling).
Finally, the dashboard updates its visualizations based on the received data. For example, imagine a system monitoring server load. Data from server metrics is sent via WebSockets to the dashboard. The dashboard processes this data, calculating average CPU usage and memory consumption. This processed data is then displayed on the dashboard, updating dynamically as new data arrives.
Data Processing and Visualization Considerations
Efficient data processing is critical for real-time dashboards. Techniques like data streaming and incremental updates minimize processing delays. Visualization libraries need to be chosen carefully to handle high-volume data streams effectively. Consider using libraries optimized for performance and capable of rendering updates smoothly. For example, using a library that efficiently updates only the changed parts of a chart instead of redrawing the entire chart each time.
This reduces the visual “jitter” and improves responsiveness.
Security and Best Practices
Dynamic dashboards, while offering incredible visualization and analytical capabilities, introduce new security challenges. Protecting sensitive data and ensuring the integrity of your dashboard is paramount. Failing to address these concerns can lead to data breaches, unauthorized access, and reputational damage. This section Artikels potential risks and best practices for building secure and robust dynamic dashboards.Protecting your dynamic dashboard requires a multi-layered approach, combining technical safeguards with well-defined policies and procedures.
The goal is to minimize vulnerabilities and create a system that is both user-friendly and secure. Ignoring security best practices can have serious consequences, impacting data integrity, user trust, and regulatory compliance.
Data Security and Access Control
Implementing robust data security measures is crucial for protecting sensitive information displayed on your dynamic dashboards. This involves controlling access to data sources, encrypting data both in transit and at rest, and regularly auditing access logs to identify any suspicious activity. For instance, implementing role-based access control (RBAC) ensures that only authorized users can access specific data or functionalities within the dashboard.
Furthermore, encryption protocols such as TLS/SSL should be used to secure communication between the dashboard and its data sources. Regular security audits and penetration testing can help identify and address vulnerabilities before they are exploited.
Authentication and Authorization
Secure authentication mechanisms are essential to verify the identity of users attempting to access the dashboard. Strong passwords, multi-factor authentication (MFA), and single sign-on (SSO) integration with existing enterprise systems are recommended. Authorization mechanisms, such as role-based access control (RBAC), ensure that users only have access to the data and functionalities relevant to their roles and responsibilities. For example, a manager might have access to all data, while a junior analyst might only see specific reports.
Regular password changes and security awareness training for users are also critical.
Data Validation and Input Sanitization
Data validation and input sanitization are vital to prevent malicious code injection attacks. All user inputs should be thoroughly validated and sanitized before being processed or displayed on the dashboard. This prevents attackers from injecting malicious scripts or SQL injection attacks that could compromise the dashboard’s integrity or steal sensitive data. Implementing robust input validation techniques and using parameterized queries to interact with databases are effective countermeasures.
Regular security updates for the dashboard’s underlying software and libraries are also necessary.
Best Practices for Dashboard Design and Development, How to build dynamic dashboards an introduction
Building secure and robust dynamic dashboards requires a proactive approach throughout the entire design and development lifecycle. Following best practices ensures a secure and reliable system.
- Secure Data Storage: Employ encryption and access controls for all data at rest and in transit.
- Regular Security Audits: Conduct periodic security assessments to identify and address vulnerabilities.
- Input Validation: Sanitize and validate all user inputs to prevent injection attacks.
- Least Privilege Access: Grant users only the necessary permissions to perform their tasks.
- Secure Coding Practices: Follow secure coding guidelines to minimize vulnerabilities.
- Regular Updates: Keep all software and libraries up-to-date with security patches.
- Monitoring and Logging: Implement robust monitoring and logging to detect and respond to security incidents.
- Data Backup and Recovery: Implement a robust backup and recovery plan to protect against data loss.
- Security Awareness Training: Educate users on security best practices to minimize human error.
- Compliance: Ensure compliance with relevant industry regulations and standards.
Deployment and Maintenance
Getting your dynamic dashboard live and keeping it running smoothly is crucial. Deployment involves moving your dashboard from a development environment to a production environment where end-users will access it. Maintenance ensures the dashboard remains accurate, efficient, and secure over its lifespan. Both are vital for maximizing the value of your investment.Deployment of a dynamic dashboard involves several steps, from preparing the application to configuring the server environment and ensuring seamless user access.
The process needs careful planning and execution to avoid disruptions and maintain optimal performance.
Deployment Options
Choosing the right deployment method depends on factors like your infrastructure, budget, and technical expertise. Several common options exist, each with its own set of advantages and disadvantages.
- On-Premise Deployment: This involves hosting the dashboard on your own servers within your organization’s infrastructure. Advantages include greater control over security and data, and potential cost savings in the long run if you already have the necessary infrastructure. Disadvantages include higher upfront investment in hardware and software, increased maintenance responsibilities, and potential scalability limitations.
- Cloud Deployment: Leveraging cloud platforms like AWS, Azure, or Google Cloud provides scalability, flexibility, and reduced infrastructure management overhead. Advantages include easy scalability to handle increased user traffic, automatic backups and disaster recovery, and pay-as-you-go pricing models. Disadvantages can include vendor lock-in, potential security concerns if not properly configured, and ongoing cloud service costs.
- Hybrid Deployment: A combination of on-premise and cloud deployment allows for a balanced approach, utilizing the strengths of both environments. For instance, sensitive data might be stored on-premise while less critical components reside in the cloud. This approach offers flexibility but adds complexity to management.
Maintenance Strategies
Maintaining a dynamic dashboard is an ongoing process that requires proactive measures to ensure data accuracy, performance, and security.
- Regular Updates: Implementing a schedule for software updates, bug fixes, and security patches is vital. This ensures the dashboard remains functional and secure against vulnerabilities.
- Data Validation: Regularly checking data sources for accuracy and consistency is critical to prevent inaccurate visualizations and reports. This may involve implementing data quality checks and automated alerts.
- Performance Monitoring: Monitoring dashboard performance metrics, such as response times and resource utilization, helps identify and address performance bottlenecks. Tools for monitoring and logging are essential.
- Security Audits: Regular security assessments are necessary to identify and mitigate potential security risks. This might involve penetration testing and vulnerability scanning.
- User Feedback: Collecting and acting upon user feedback is important for continuous improvement. This ensures the dashboard meets the needs of its users and remains relevant.
Version Control and Rollback
Implementing a robust version control system (like Git) is essential for tracking changes to the dashboard’s codebase. This allows for easy rollback to previous versions in case of issues or unexpected errors after deployment. A clear versioning strategy facilitates collaborative development and simplifies maintenance. The ability to quickly revert to a stable version minimizes downtime and reduces the risk of data loss or corruption.
Final Summary
Building dynamic dashboards is more than just a technical skill; it’s about crafting a powerful tool that empowers users with data-driven insights. This introduction has provided a foundational understanding of the key components, technologies, and best practices involved in creating effective and engaging dynamic dashboards. From understanding the different types of dashboards and their applications to mastering the art of data visualization and interactive design, you’ve gained the essential knowledge to start your own projects.
Remember, the journey to mastering dynamic dashboards is iterative; keep experimenting, refining your designs, and adapting your approach based on user feedback and evolving needs. Now go forth and build something amazing!
User Queries: How To Build Dynamic Dashboards An Introduction
What are the limitations of using free dashboarding tools?
Free tools often have limitations on data storage, features, and customization options. They might also lack advanced security features or robust support.
How do I choose the right data visualization for my dashboard?
The best visualization depends on the type of data and the insights you want to convey. Consider your audience and the story you’re trying to tell. Line charts for trends, bar charts for comparisons, maps for geographical data, etc.
What’s the difference between a dashboard and a report?
Dashboards are interactive and provide a high-level overview of key metrics, while reports are typically static documents that provide detailed analysis.
How important is user experience (UX) in dashboard design?
UX is crucial! A poorly designed dashboard, no matter how powerful the data, will be unusable. Focus on clear visuals, intuitive navigation, and easy data interpretation.